Data observability vendor Acceldata on Wednesday raised $50 million in venture capital funding, bringing the startup’s total funding to more than $95 million.
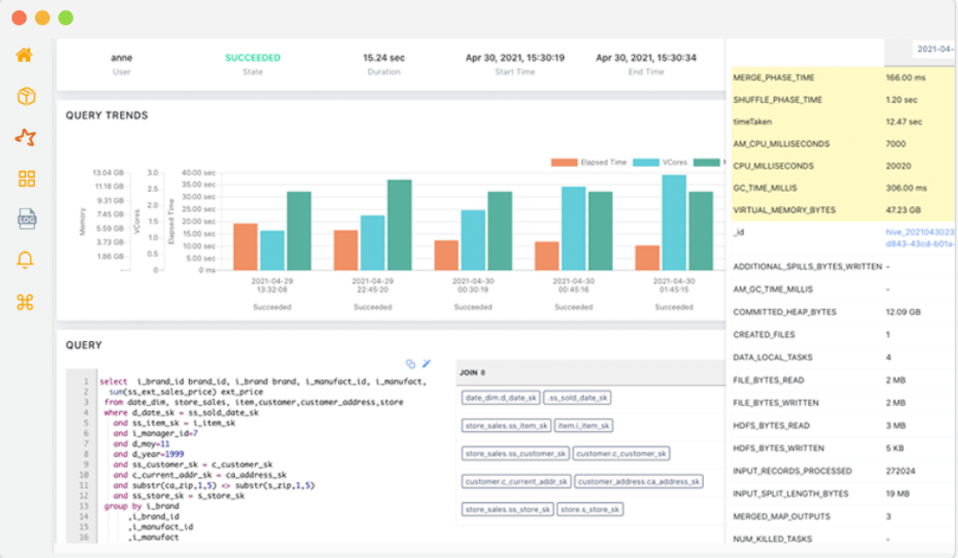
Founded in 2018 and based in Campbell, Calif., Acceldata offers a data observability platform designed to enable customers to monitor their data and gain insight into the overall health of their data and analytics infrastructure.
The funding was the vendor’s series C round, following a series B round of $35 million in September 2021. March Capital led Acceldata’s series C round, with participation from Industry Ventures, Sanabil Investments and Insight Partners.
“Data observability helps improve both the performance of data pipelines and the quality of the data itself,” Petrie said. “Data teams need these tools to ensure they deliver timely, accurate data to the users and applications that need them for analytics.”
What is Data Observability?
Data observability tools use automated monitoring, automated root cause analysis, data lineage and data health insights to detect, resolve, and prevent data anomalies. This leads to healthier pipelines, more productive teams, better data management, and happier customers.

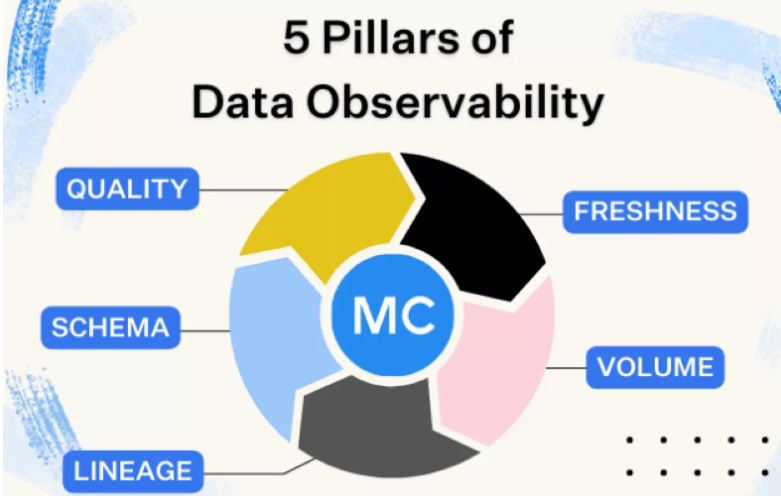
The five pillars of data observability are:
- Freshness
- Quality
- Volume
- Schema
- Lineage
Together, these components provide valuable insight into the quality and reliability of your data. Let’s take a deeper dive.
Freshness: Freshness seeks to understand how up-to-date your data tables are, as well as the cadence at which your tables are updated. Freshness is particularly important when it comes to decision making; after all, stale data is basically synonymous with wasted time and money.
Quality: Your data pipelines might be in working order but the data flowing through them could be garbage. The quality pillar looks at the data itself and aspects such as percent NULLS, percent uniques and if your data is within an accepted range. Quality gives you insight into whether or not your tables can be trusted based on what can be expected from your data.
Volume: Volume refers to the completeness of your data tables and offers insights on the health of your data sources. If 200 million rows suddenly turns into 5 million, you should know.
Schema: Changes in the organization of your data, in other words, schema, often indicates broken data. Monitoring who makes changes to these tables and when is foundational to understanding the health of your data ecosystem.
Lineage: When data breaks, the first question is always “where?” Data lineage provides the answer by telling you which upstream sources and downstream ingestors were impacted, as well as which teams are generating the data and who is accessing it. Good lineage also collects information about the data (also referred to as metadata) that speaks to governance, business, and technical guidelines associated with specific data tables, serving as a single source of truth for all consumers.
He added that tools to observe data quality are not new.
What is new, however, is the use of augmented intelligence and machine learning (ML) to foresee trouble within a data pipeline and enable organizations to take proactive measures. Also new are the scale and complexity of the data pipelines that the observability tools must now monitor.
“Data quality tools have existed for some time, [but] modern data observability tools such as Acceldata apply new AI/ML techniques and new levels of automation to detect and correct data quality issues,” Petrie said. “They also help predict, measure and optimize the performance of data pipelines, all in the context of hybrid or multi-cloud environments.”
Beyond the need for better data observability due to the exponential increases in data volume and complexity, a shortage of data engineers is increasing the need for data observability tools, noted Rohit Choudhary, founder and CEO of Acceldata.
Data engineers prepare data for analysis, which includes monitoring data throughout its lifecycle to ensure its quality. But since 2016, demand for data engineers has outpaced supply, according to QuantHub.
Acceldata and its peers automate data observability, enabling organizations to not only overcome the shortage of data engineers — at least when it comes to data observability — but also gain greater vision into their data, given that machines can oversee vast amounts of data far more quickly and thoroughly than even a team of humans.
“Talent continues to be flat,” Choudhary said. “There are not enough high-quality data engineers. As an outcome of this — the exponential increase of data, the exponential increase of system complexity and the lack of talent — you need automation.”
New opportunities
Since its inception, Acceldata has targeted large, often multinational organizations.

While smaller companies can use its tools, its platform is geared toward corporations that make up the Global 2000 and Fortune 500; Acceldata does not publicize its pricing. The result in 2022 was more than 100% year-over-year revenue growth, the vendor said.
With $50 million in new funding, Acceldata plans to invest in its go-to-market strategy to continue targeting large enterprises. In particular, it plans to invest in making more organizations aware of the benefits of data observability, according to Choudhary.
“We will invest in our go-to-market strategy, including spending time and effort educating the market and making them aware of how strong the benefits of data observability are for the enterprise,” he said.
Choudhary added that the funding puts Acceldata in position to make an acquisition, if the right opportunity arises. The vendor has made small acquisitions, purchasing pieces of companies, but has not yet made a full-scale acquisition.
“If there are acquisition opportunities in the next couple of years, consolidation opportunities, we can take advantage of that,” Choudhary said.
Beyond the expansion an extra $50 million will enable, Choudhary noted that the funding shows Acceldata is on the right path and data observability is a growing market.
Over the past year, venture capitalists have been much more selective with their investments. Before 2022, funding for data and analytics vendors was plentiful. For example, Databricks raised a striking $1 billion in February 2021, while another nine deals topped $100 million.
That slowed drastically in 2022 when technology vendors were hit hard by the decline in the capital markets throughout the first half of the year. No funding deals for data and analytics vendors in 2022 came even close to the value of Databricks’ series G round, and far fewer topped $100 million than the year before.
Roadmap
Acceldata updates its platform regularly, releasing new versions every three weeks.
Given that rapid release cycle combined with the niche its platform serves, Acceldata’s tools cover all the major aspects of data observability, according to Petrie.
Therefore, beyond tweaks to existing features that address data quality and oversee data pipeline performance, opportunities for growth lie in expanding beyond data observability into other areas of data management.
In particular, data operations (DataOps) represents a logical next step for Acceldata given its relationship to data observability, Petrie noted.
“To expand, it might consider branching into DataOps,” he said. “For example, [it could help] more with the development and orchestration of data pipelines. Data observability [is] a foundational element of DataOps.”
Meanwhile, Choudhary said Acceldata’s roadmap focuses on three main areas, which include the addition of various new capabilities on a regular schedule every three weeks:
- the price and performance of its platform so that users can know what they’re spending for the amount of compute power they require;
- reliability to help customers develop high-quality data sets; and
- continuing to add functionality to give organizations better operational control over hybrid systems.
Addressing need
Once a relatively simple process when organizations had fewer data sources, kept most of their data in a single on-premises database and used fewer tools to build their analytics stack, data observability is becoming more complex.
Organizations now ingest data from an exponentially growing number of sources, store it in myriad databases — both in the cloud and on premises — and use a wide array of tools to integrate, prepare and analyze data.
And without quality data, an organization’s entire data operation doesn’t work effectively.
As a result, vendors such as Acceldata, IBM Databand and Monte Carlo have emerged to address what is both a growing and essential need, according to Kevin Petrie, an analyst at Eckerson Group.
Data observability helps improve both the performance of data pipelines and the quality of the data itself. Data teams need these tools to ensure they deliver timely, accurate data to the users and applications that need them for analytics.
The origins of data observability
I started thinking about the concept that I would later label “data observability” when I was serving as the former VP of Customer Success Operations at Gainsight.
Time and again, we’d deliver a report, only to be notified minutes later about issues with our data. It didn’t matter how strong our ETL pipelines were or how many times we reviewed our SQL: our data just wasn’t reliable.
Unfortunately, this problem wasn’t unique. After speaking with hundreds of data leaders about their biggest pain points, I learned that data downtime tops the list.
Much in the same way DevOps applies observability to software, I thought it was time data teams leveraged this same blanket of diligence and began creating the category of data observability as a more holistic way to approach data quality.
In this post, I’ll cover:
- Data observability is as essential to DataOps as observability is to DevOps
- Why is data observability important?
- The key features of data observability tools
- Data observability vs. testing
- Data observability vs. monitoring
- Data observability vs. data quality
- Data observability vs. data reliability engineering
- Data quality vs data reliability
- Signs you need a data observability platform
- The future of data observability
Data observability is as essential to DataOps as observability is to DevOps
As organizations grow and the underlying tech stacks powering them become more complicated (think: moving from a monolith to a microservices architecture), it became important for DevOps teams within the software engineering department to maintain a constant pulse on the health of their systems and deploy continuous integration and development (CI/CD) approaches.
Observability, a more recent addition to the software engineering lexicon, speaks to this need, and refers to the monitoring, tracking, and triaging of incidents to prevent software application downtime.
At its core, there are three pillars of observability data :
Metrics refer to a numeric representation of data measured over time.
Logs, a record of an event that took place at a given timestamp, also provide valuable context regarding when a specific event occurred.
Traces represent causally related events in a distributed environment.
(For a more detailed description of these, I highly recommend reading Cindy Sridharan’s landmark post, Monitoring and Observability).
Taken together, these three pillars and application management (APM) solutions like DataDog or Splunk, gave DevOps teams and software engineers valuable awareness and insights to predict future behavior, and in turn, trust their IT systems to meet SLAs.
Data engineering teams needed similar processes and tools to monitor their ETL (or ELT) pipelines and prevent data downtime across their data systems. Enter data observability.
Also Read: